
Figure 3.
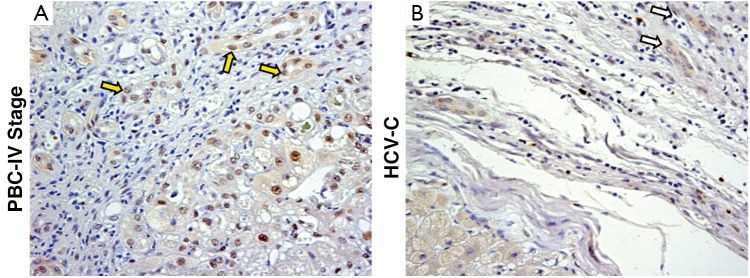
Immunohistochemistry for PCNA. Evaluation of the % of PCNA+ ductular cells (PI-DR) in PBC (A) and HCV-C (B). The PI-DR is higher in PBC (yellow arrows) in comparison with HCV-C (white arrows). For semi-quantitative analysis see Table 1. Original magnification 20× (A-D)