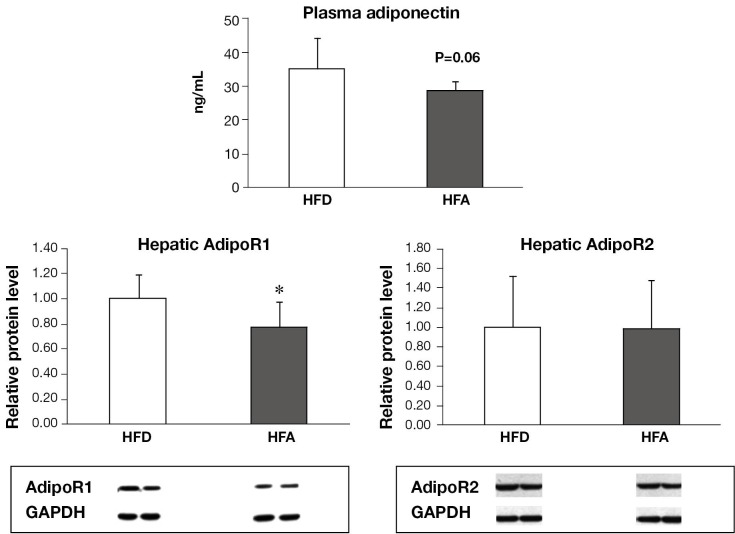
Figure 3.
Plasma adiponectin and hepatic relative protein expression of AdipoR1 and AdipoR2. Means ± SD are shown. Statistical analyzes was performed by student’s unpaired t-test (*P<0.05 between groups). AdipoR1, adiponectin receptor 1; AdipoR2, adiponectin receptor 2; HFD, high fat diet; HFA, high fat diet plus alcohol.

