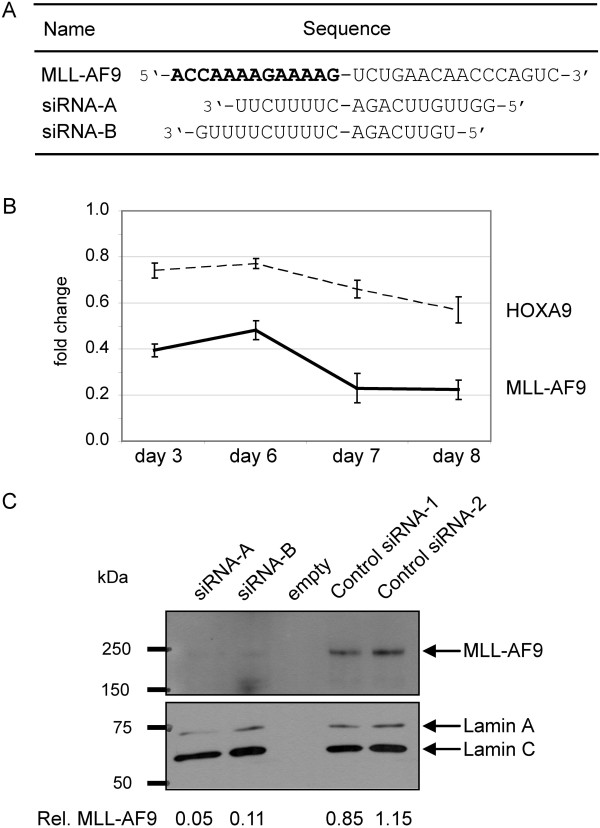
Figure 1.
SiRNA knockdown of MLL-AF9 in THP1 cells. (A) Alignments of siRNAs to MLL-AF9 mRNA. Bold sequence represents the MLL part of the fusion transcript. (B) Confirmation of MLL-AF9 knockdown via RT-qPCR. Mean relative MLL-AF9 and HOXA9 transcript levels of knockdown (siRNA-A, siRNA-B) as compared to control treatments (control siRNA-1, -2) during the time course of experiments. Graph represents data from five independent experiments. Bars indicate standard deviation. (C) Immunoblot of MLL-AF9 from total protein extracted from day 8 experimental samples. Normalized MLL-AF9 levels are indicated at the bottom.

