
Figure 2.
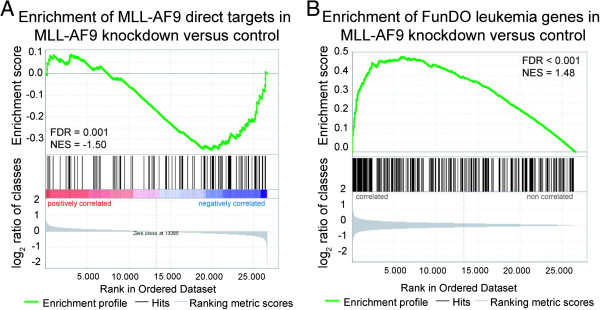
Gene set enrichment plots for our gene expression profile after knockdown of MLL-AF9 in THP1 cells. (A) Gene set enrichment plot of direct MLL-AF9 targets previously detected by Bernt et al. [13] in a mouse model. (B) Gene set enrichment plot of the leukemia gene set defined by FunDO. Because MLL-AF9 acts as a transcriptional activator, enrichment of direct targets was analyzed for the set of up- or down-regulated genes (A), while the gene set altered in leukemia was analyzed for deregulated genes in general (B). FDR, false discovery rate q-value; NES, normalized enrichment score.