
Figure 4.
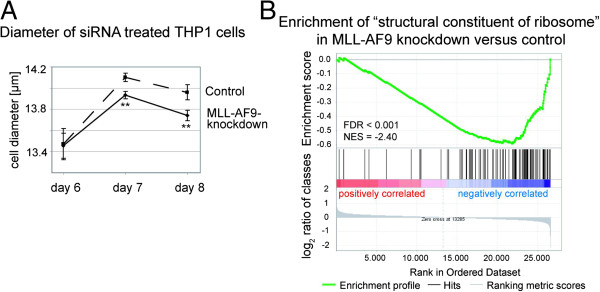
Effects of MLL-AF9 knockdown in THP1 cells related to cell size. (A) Mean cell diameter between MLL-AF9 knockdown and non-targeting siRNA control cells was significantly altered on day 7 and 8 of experiments. Graph represents data from five independent experiments. Bars indicate standard deviation. **p < 0.005. (B) Gene set enrichment plot of genes from the gene ontology term “structural constituent of ribosome” (GO:0003735) for our gene expression profile after MLL-AF9 knockdown in THP1 cells. FDR, false discovery rate; NES, normalized enrichment score.