
Figure 6.
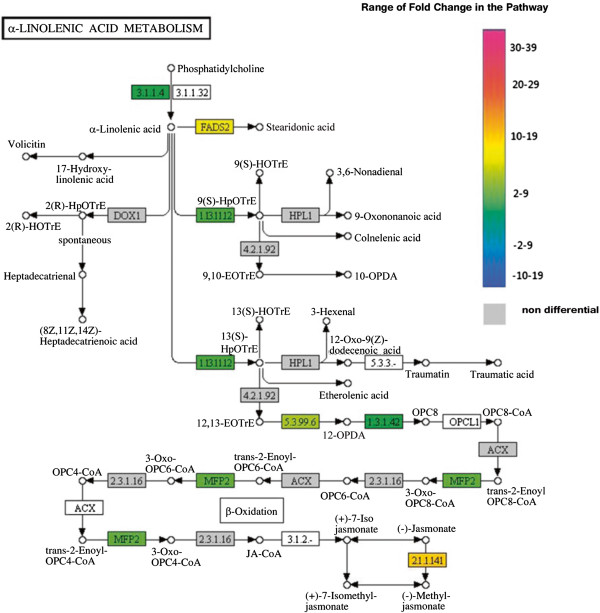
Alfa-Linolenic acid metabolism pathway (KEGG database). Enzymes are identified by E.C. number and those corresponding to differentially expressed genes are highlighted according to the color scale. Color codes for each gene at T0 are as follows: red for up-regulated, green for down-regulated and grey for no differential expression. E.C number and correspondent enzyme: 1.3.1.42 – 12-oxophytodienoate reductase; 3.1.1.4 – Phospholipase A2; 1.13.11.12 – Linoleate 13S-lipoxygenase; 5.3.99.6 – Allene oxide cyclase; 2.1.1.141 - Jasmonate O-methyltransferase; FADS2 – fatty acid desaturase 2 ; MFP2 – 3-hydroxyacyl-CoA dehydrogenase/ enoyl-CoA hydratase.