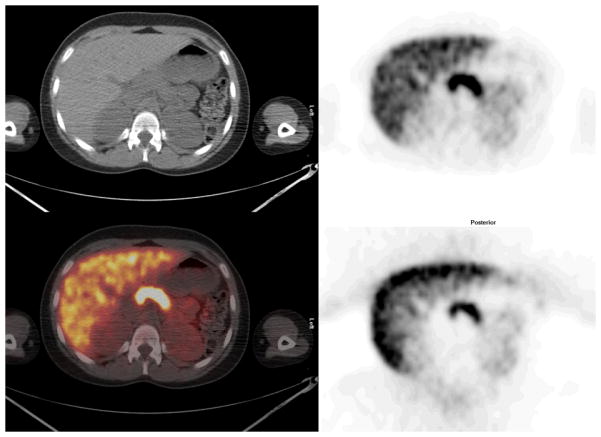
FIGURE 5.
Mid abdomen: Cross sectional representations of activity seen at various levels of the body. Upper row left column attenuation correction CT scan, upper row right column attenuation corrected PET image, lower row left column fusion image of CT and attenuation corrected PET image, and bottom right, non attenuation corrected PET image. The attenuation corrected PET image is scaled to a maximum SUV of 12.

