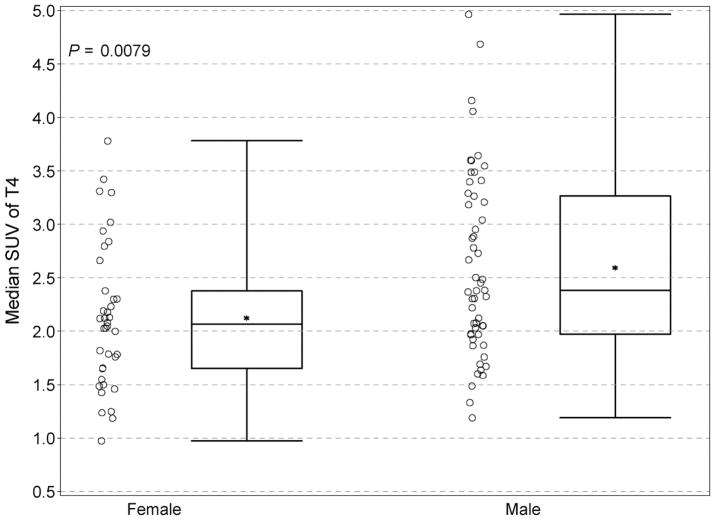
FIGURE 8.
Comparison of uptake between females and males in T5. Slightly greater uptake in both the median (*) and mean SUVmax values was present in males. Individual data points are depicted, along with the group median (solid horizontal line in the rectangular box), the group mean (* symbol), the first and third quartiles above and below the group median (rectangular box), and the minimum and maximum SUV values (top and bottom horizontal lines).

