
Figure 5.
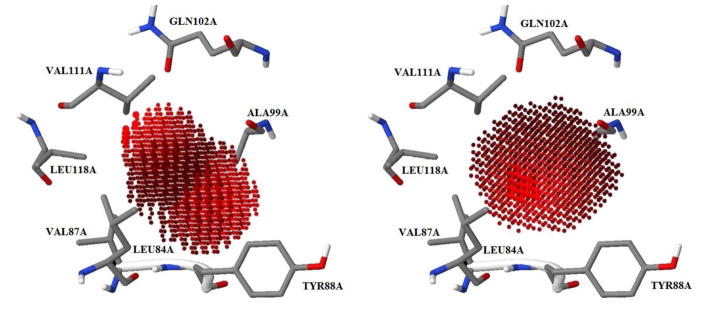
Heat maps for sp3 oxygen (left) and aromatic carbon (right). Grid points with lighter color indicate energetically favorable locations for certain atom types within the binding pocket.
Official websites use .gov
A
.gov website belongs to an official
government organization in the United States.
Secure .gov websites use HTTPS
A lock (
) or https:// means you've safely
connected to the .gov website. Share sensitive
information only on official, secure websites.
Heat maps for sp3 oxygen (left) and aromatic carbon (right). Grid points with lighter color indicate energetically favorable locations for certain atom types within the binding pocket.