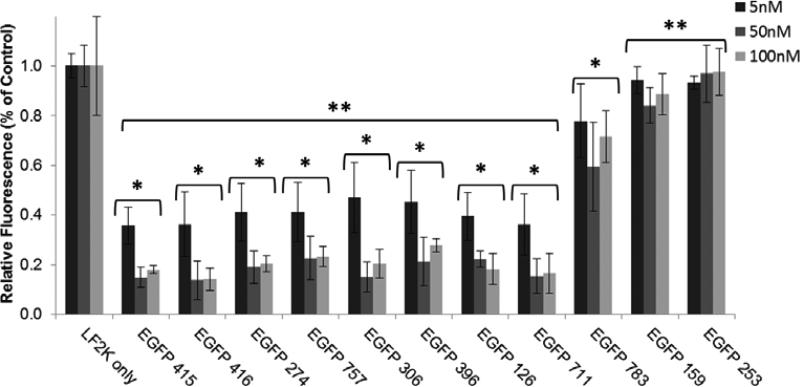
Figure 2. Silencing of EGFP by selected siRNAs.
H1299 cells expressing EGFP were treated with 5, 50, and 100 nM of siRNA for 24 h using Lipofectamine 2000 (LF2K). Results are normalized EGFP fluorescence of LF2K-only treated control cells. siRNA treatments are ordered based on algorithm predictions (415 = highest predicted activity, 253 = lowest predicted activity). Error bars = +/− 1 standard deviation, n =4 (5 nM), 5 (50 nM), and 3 (100nM). Single stars indicate a significant difference (p < 0.05) compared to LF2K only treatments. Double stars indicate a significant difference (p < 0.05) compared to EGFP 783.

