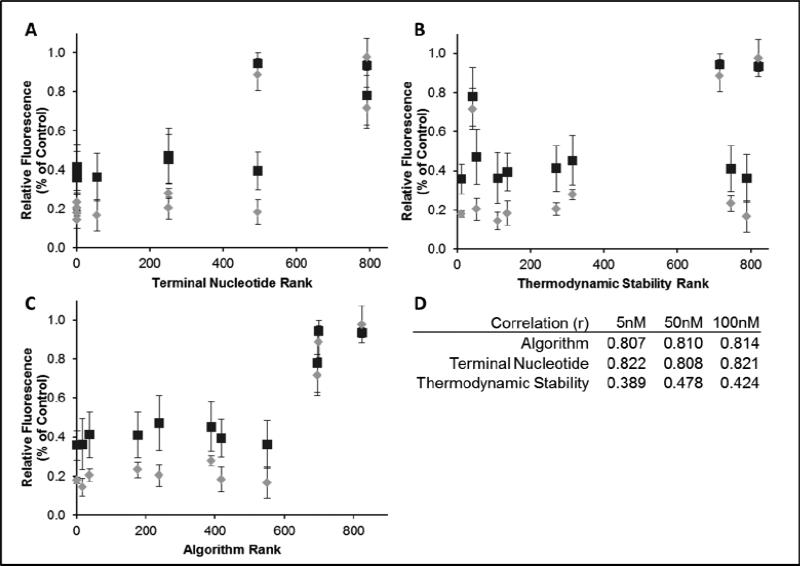
Figure 3. Correlation of exogenous gene silencing with each feature of the algorithm.
EGFP silencing results graphed against terminal nucleotide rank only (A), ΔΔG values only (B) or algorithm rank (C). The squares represent 5 nM siRNA while the diamonds are 100 nM siRNA treatments. For visual clarity, the 50 nM data points were not included in the plots but follow the same trend in silencing activity. The correlation coefficients for each dataset are tabulated (D).

