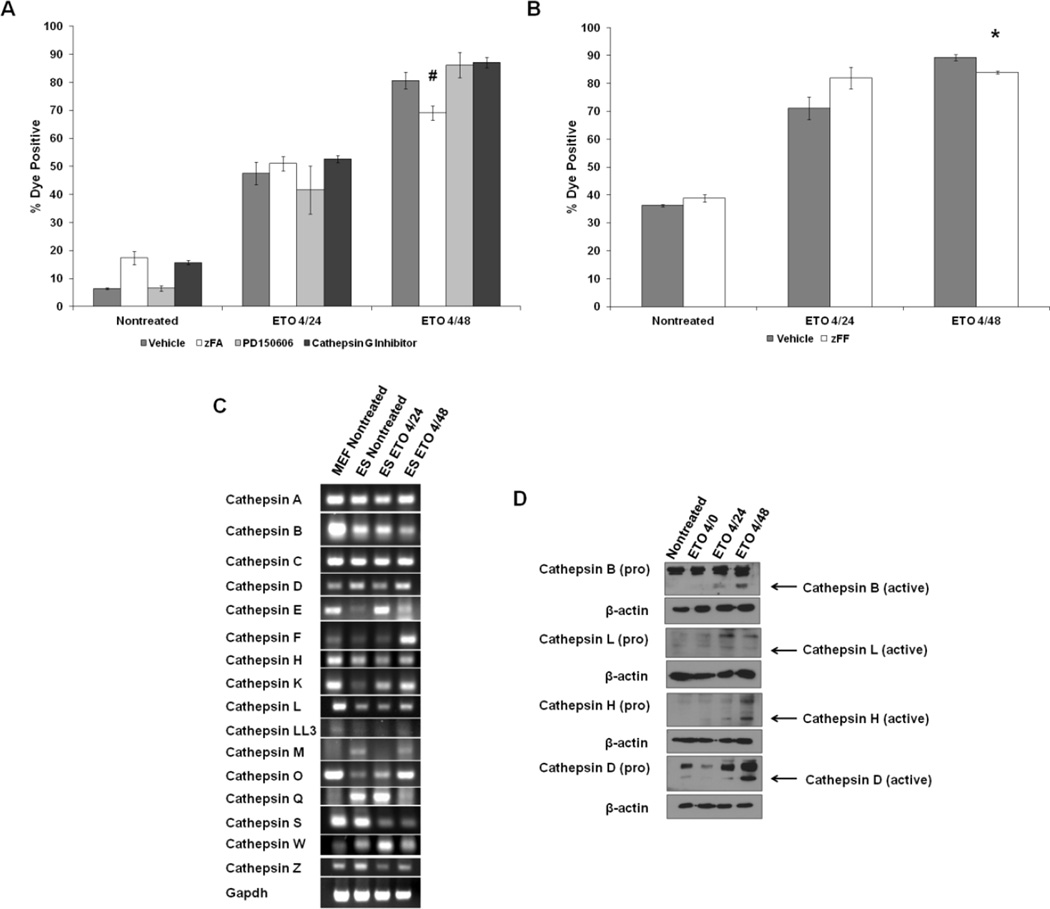
Figure 3. Role of lysosomal proteases in ETO PCD.
A. ESCs were treated with ETO or left nontreated and coincubated with zFA to inhibit lysosomal proteases B, L, S, and H, PD150606 to inhibit calpains 1 and 2, or a cathepsin G inhibitor and subjected to flow cytometry to measure loss of plasma membrane integrity. A minimum of 6 experiments are displayed. Error bars represent the SEM. B. ESCs were treated with zFF and cotreated with ETO as indicated. Flow cytometry measuring violet cell stain is displayed. C. RT-PCR of murine cathepsins. RNA was isolated from nontreated MEFs, ESCs, as well as ESCs treated with ETO and harvested at the 4/24 and 4/48 time points. Complimentary DNA was generated and PCR was performed using primers designed against murine cathepsins. Gapdh served as a loading control. D. ESCs were treated as indicated and whole cell extracts were used for western blots. Levels of inactive (pro) and active cathepsins are displayed. Actin served as a loading control. *p<0.05#p<0.01.

