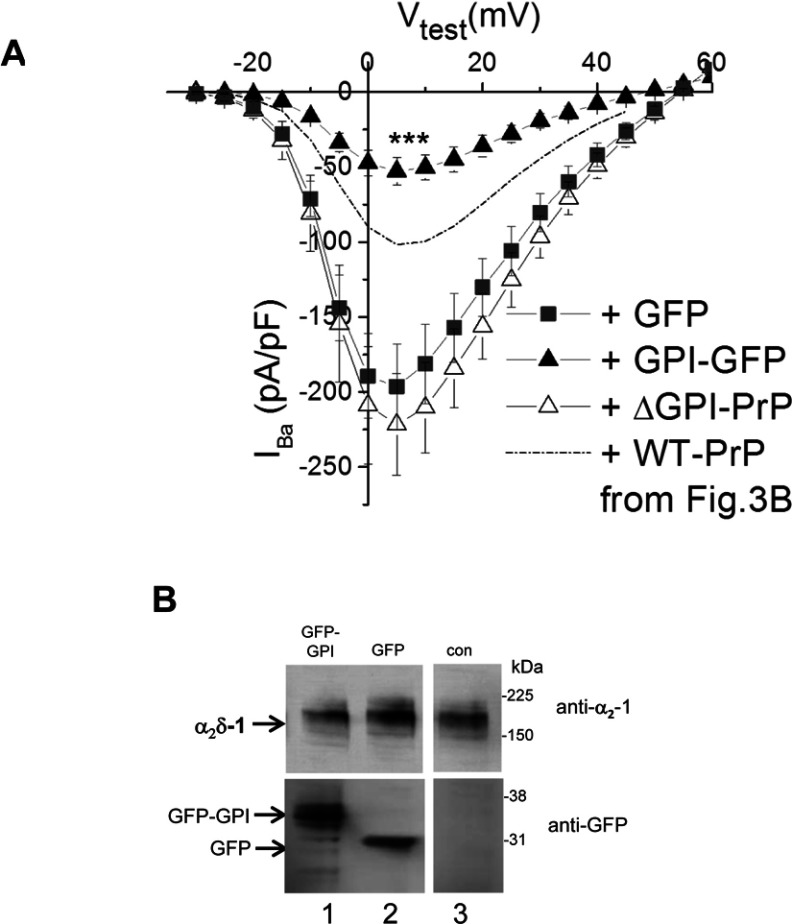
Figure 5. Effect of GPI–GFP on CaV2.1/β1b/α2δ-1 calcium channel currents.
(A) I–V relationships for IBa recorded from tsA-201 cells expressing CaV2.1/β1b/α2δ-1 with GFP (■; n=9), GPI–GFP (▲; n=9), or GFP and ΔGPI–PrP (△; n=6). The broken line indicates the level of IBa observed for CaV2.1/β1b/α2δ-1 plus WT PrP from Figure 3(B). ***P<0.001 between the peak IBa when GPI–GFP was co-expressed compared with when GFP was co-expressed (Student's t test). (B) Western blot of α2δ-1 (upper panels) co-expressed (1:1) with GFP–GPI (lane 1), GFP (lane 2) or empty vector (lane 3; con). GFP expression is shown in the lower panel. All three lanes are from the same blots from which irrelevant lanes have been excised and the molecular mass is given on the right-hand side in kDa.

