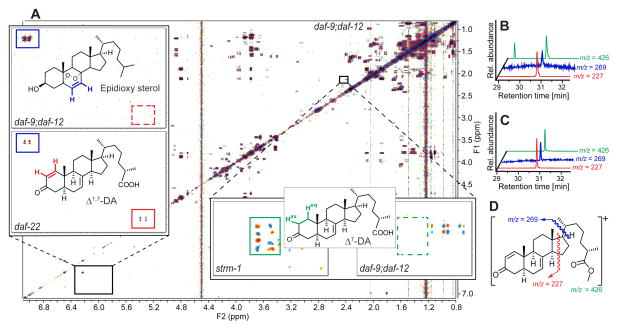
Figure 3. Detection and identification of endogenous DAF-12-ligand candidates via 2D NMR-based comparative metabolomics and SIM-GC/MS.
(A) dqfCOSY spectrum of inactive daf-9;daf-12 metabolome fraction corresponding to active region I (Figures 2C–2E). Enlarged section (upper left) compares daf-9;daf-12 with the corresponding section of the daf-22 spectrum, showing one of the differential crosspeaks (red) that led to identification of Δ1,7-DA, next to non-differential signals representing a metabolite present in both daf-9;daf-12 and daf-22, an epidioxy sterol (blue). Enlarged section (lower right) shows example crosspeaks from the comparison of the spectra of strm-1 (vide infra) and daf-9;daf-12 metabolomes, showing signals (green) characteristic for Δ7-DA in the strm-1 spectrum but not the daf-9;daf-12 spectrum.
(B) SIM-GC/MS of active daf-22 metabolome fraction indicating the presence of Δ1,7-DA. The additional peak at ~29.4 min in the ion trace m/z = 426 belongs to an unrelated compound.
(C) SIM-GC/MS of synthetic Δ1,7-DA confirm retention times and fragmentation patterns.
(D) Major EI-MS fragments of Δ1,7-DA used in Figures 3B and 3C.
See also Figure S2

