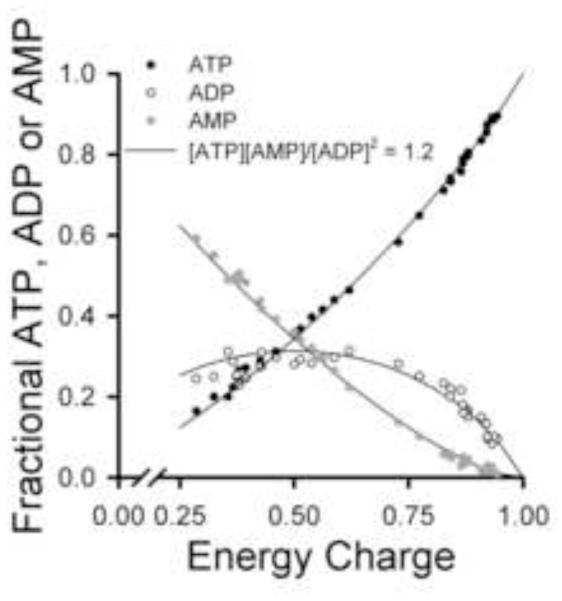
Figure 2. Lung tissue fractional concentrations of ATP, ADP and AMP vs energy charge for the experimental treatments in Protocol 1 studies.
The symbols are the fractional adenine nucleotide values calculated from individual lung adenine nucleotide measurements that make up the mean values in Table 1 (n = 36). Energy charge was calculated as described in the Figure 1 legend. The solid lines show the theoretical proportions of ATP, ADP and AMP present at the indicated energy charge if the adenylate kinase equilibrium [ATP][AMP]/[ADP]2 = 1.2 was controlling the relative amounts of the adenine nucleotides [35].

