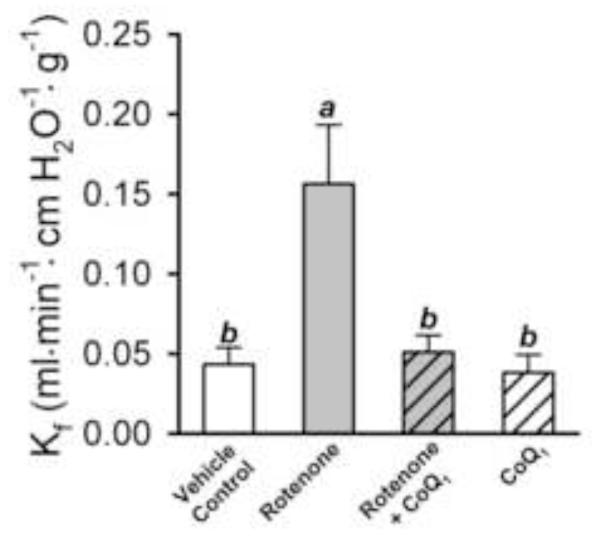
Figure 5. Effect of rotenone and CoQ1 on the filtration coefficient (Kf) in rat lung in Protocol 2 studies.
The bars represent the means ± SE for Kf measured in vehicle control (n = 13), rotenone (n = 6), rotenone + CoQ1 (n = 6), or CoQ1 (n = 7) treated lungs. Means with the same letter designation are not significantly different (p>0.05); means with different letter designations are significantly different from each other (p<0.05).

