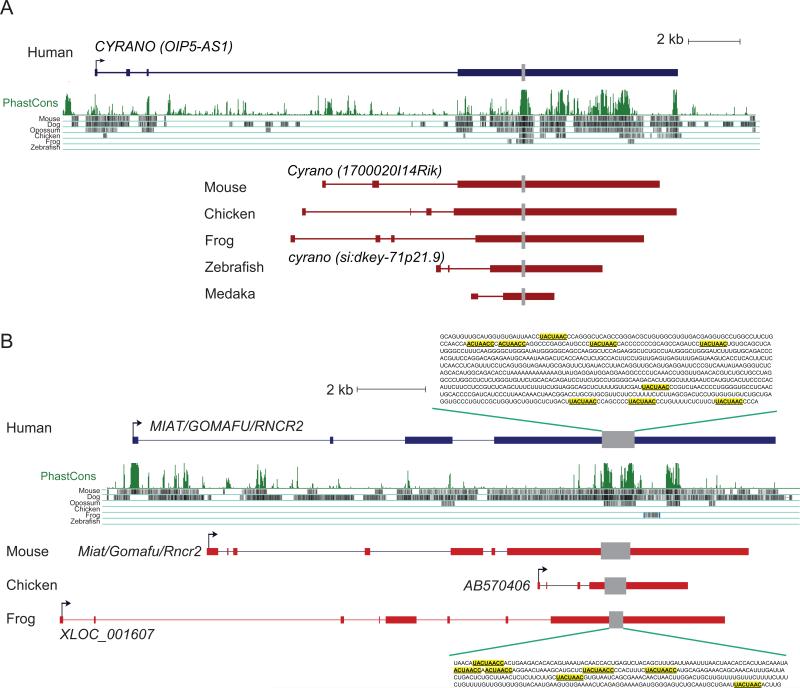
Figure 3. Evolution of Cyrano and Miat lincRNAs.
(A) Cyrano. Gene models from the indicated species are shown, together with the PhastCons track. The gray bar indicates a ~70 nt region of homology detected in a focused search, starting with the zebrafish ortholog.
(B) Miat. Gene models from the indicated species are shown, together with the PhastCons track. The gray box indicates a region in the last exon that contains multiple copies of the (U)ACUAAC(C) motif, as shown for human and frog.

