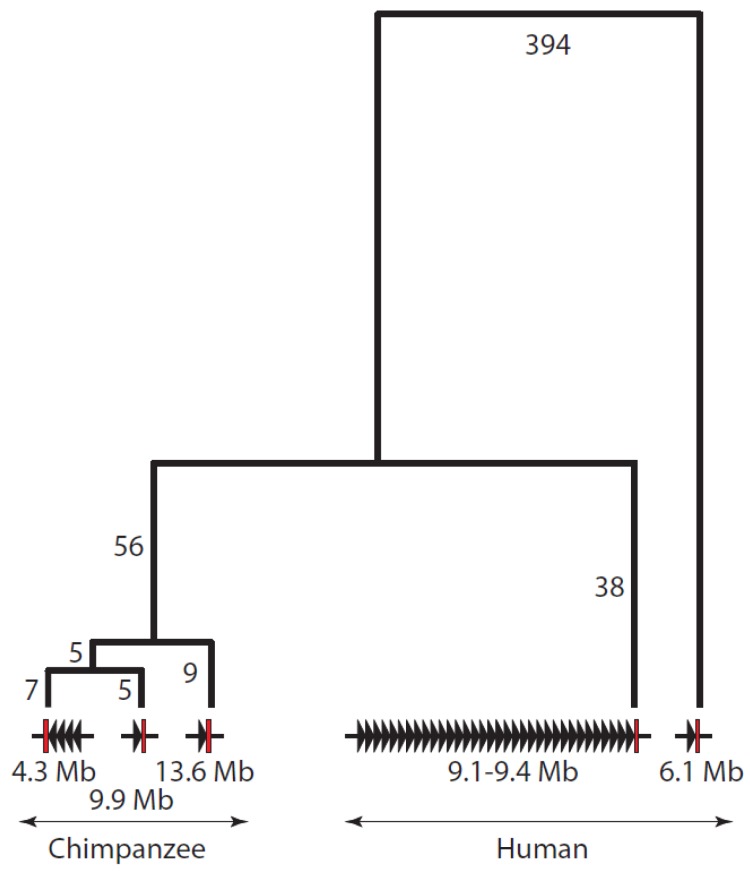
Figure 2.
Phylogenetic relationships of the two human and three chimpanzee TSPY arrays deduced from comparisons of the flanking sequences circled in Figure 1 (coordinates in text). The arrays, named according to their approximate genomic coordinates, are shown at the bottom, with active TSPY genes indicated by black arrowheads and the flanking region by a red rectangle. The topology of the tree is shown and the number of mutational events on each branch indicated, but the branches are not drawn to scale. Note that no outgroup sequence is available and the tree is unrooted.

