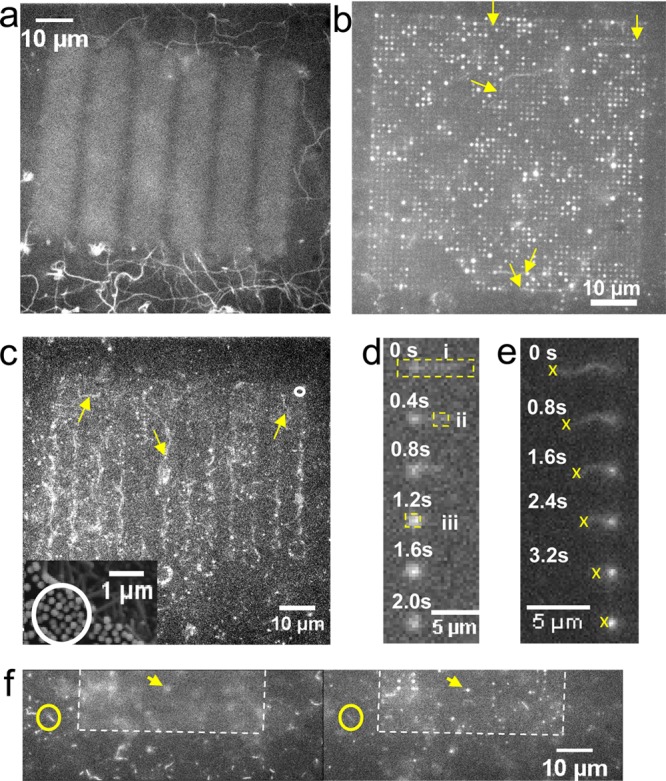
Figure 3.

Actomyosin motility on nanowire arrays analyzed by fluorescence microscopy. a, Motility on Al2O3 surface outside autofluorescent array illustrated by maximum pixel intensities over 50 consecutive images at 2.5 s–1 frame rate. Filament trajectories indicated as winding continuous lines. b, The maximum pixel intensity in sequence of 220 images at 2.5 s–1 frame rate for array with 1 μm interwire distance and 5 μm nanowire length. Arrows show starting points for some trajectories of actin filaments sliding on top of the array. c, Image sequence of array with circular and square nanowire patterns connected by zigzag lines with nanowires. Examples of filament trajectories indicated by arrows. Average interwire spacing: 250 nm (cf. scanning electron micrograph in inset showing area on another array similar to that in circle in main figure). d,e, Time sequence of filaments climbing down and up a nanowire, respectively. For dashed rectangles in panel d, see Figure 4c. The crosses in panel e indicate tracking of the trailing filament end to estimate the length of the filament segment that is vertically attached along the nanowire (fluorescent spot of increasing intensity) at each given point in time. f, Fluorescence images where focus changed from the bottom surface (left) to the top of the wires (right). See also Supporting Information Movie 3 and Figure S4 for similar effects of change in focus on another area.
