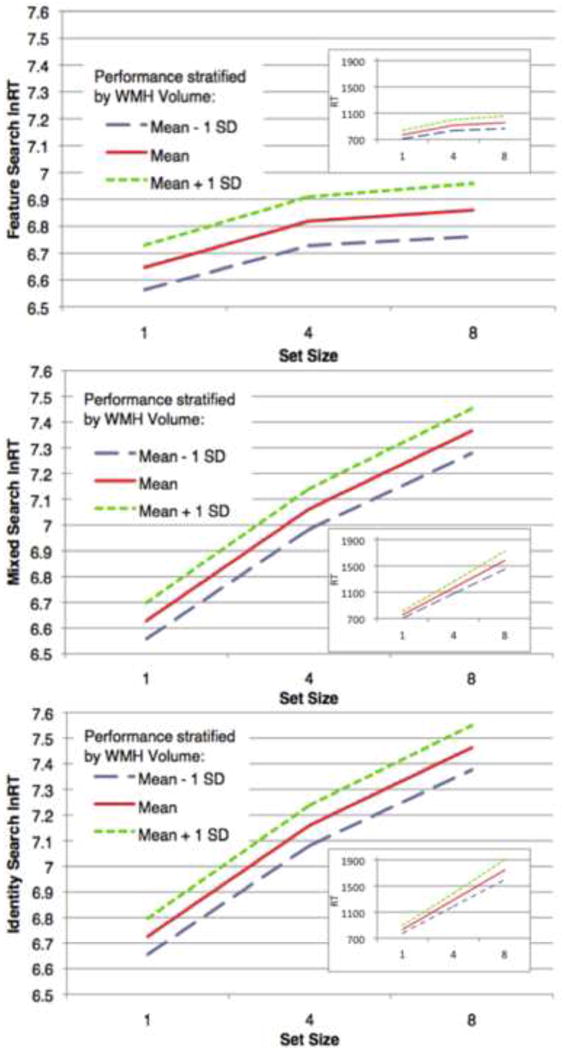
Figure 5.

These graphs illustrate how varying WMH volume modifies search performance amongst older adults. The graphs represent predicted performance, on the Feature, Mixed, and Identity search conditions for each set size, for participants whose log normalized WMH volume takes on the mean value and the mean +/- one standard deviation. Each line represents model-predicted performance for a female with mean education (14.9 years) and average length between testing and MRI (545.9 days), for red targets pointing right on the right side of the screen, for the middle trial of the experiment (overall trial 190, block trial 22). The three lines per graph represent the estimated trajectories of an individual that exhibits these characteristics along with differing levels of log-normalized WMH volume: the sample mean (-0.85, or 0.428% head size), the mean plus one standard deviation (1.25%) and the mean minus one standard deviation (0.146%). Larger graphs represent lnRT values (those tested in statistical analyses); insets represent untransformed RT (in ms) for visual comparison.
