Figure 1.

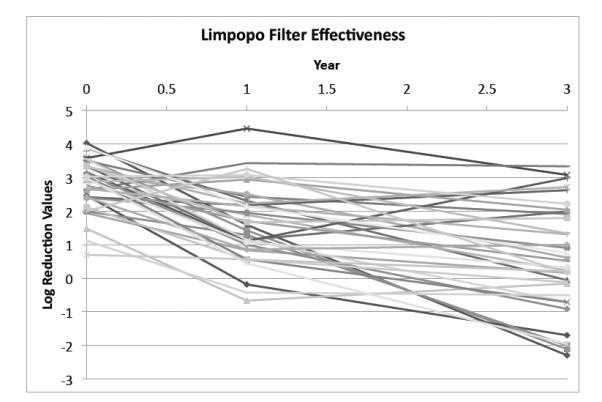
Filter log reduction values over the three year measurement period. Each line represents a single household’s CWF effectiveness over time. Missing values were filled in using standard multiple imputation techniques.

Filter log reduction values over the three year measurement period. Each line represents a single household’s CWF effectiveness over time. Missing values were filled in using standard multiple imputation techniques.