
Figure 5.
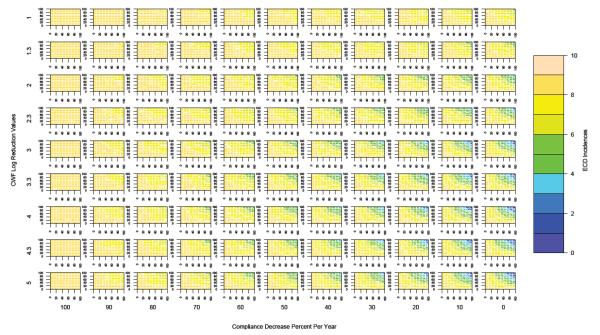
Multi-parameter contour plots of the four most salient parameters (compliance, prevalence, yearly compliance decreases and CWF (ceramic water filter) LRVs (log reduction values)). The x-axis of each individual plot represents the CWF prevalence while the y-axis represents CWF compliance. Optimal outcomes of 0-2 ECD cases over the first two years of life were only achievable if prevalence and compliance were high (80-90%) and compliance decreases were low (< 10% per year). Prevalence and compliance had a large effect on ECD cases for low rates of compliance decline, but ECD cases were less sensitive to prevalence and compliance for high rates of compliance decline. CWF LRVs had to be at least 3 in order to achieve optimal outcomes, but better LRVs did not necessarily reduce ECD cases. ECD incidences were relatively insensitive to prevalence, compliance and compliance declines for low LRVs.