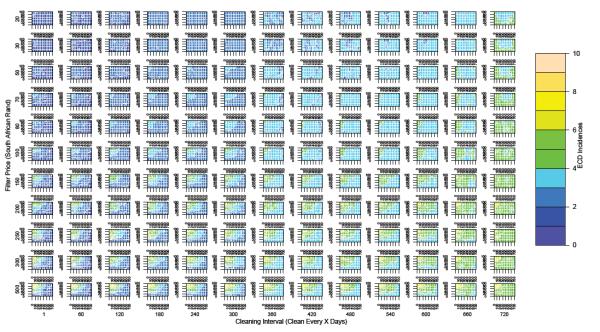
Figure 6.

Multi-parameter contour plots of the four least salient parameters (CWF price, cleaning interval, breakage percent and breakage date). All experiments assume 100% prevalence and 90% compliance. The x-axis of each individual plot represents the CWF breakage date while the y-axis represents CWF breakage percent. It is evident that optimal outcomes (ECD rates of 0-2) are only achievable if the cleaning interval is less than 120 days. However, the availability of filters for purchase for less than 100 Rand assures that ECD rates will be less than 6 irrespective of the other parameters. ECD rates are more sensitive to breakage percent and date for high purchase prices. CWF = ceramic water filter. For clarity, all plots are for threshold values of 50 CFU/100ml since ECD cases are less sensitive to that parameter.
