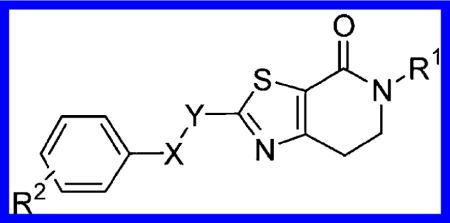
Table 1.
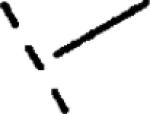
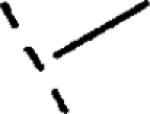
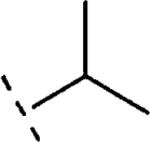
Structures and Activities of Substituted Benzyloxy- and Phenoxymethyl-dihydrothiazolopyridones 15 and 16
| |||||||||
|---|---|---|---|---|---|---|---|---|---|
| Comp | X-Y | R1 | R2 | hmGlu5 PAM EC50a (nM)19 | hmGlu5 PAM pEC50a19 | Glu Maxa (%)19 | HLMb (%) | RLMb (%) | clogPc |
| 1 | -- | -- | -- | 176 | 6.75 (86.73-6.78) | 73 (70-76) | -- | -- | -- |
| 2 | -- | -- | -- | 199 | 6.70 (6.66-6.74) | 66 (63-70) | -- | -- | -- |
| 15b | CH2-O |
|
H | 1748 | 5.76 (5.43-6.08) | 76 (55-97) | n.t.d | n.t.d | 1.7 |
| 15c | CH2-O |

|
H | 1133 | 5.95 (5.76-6.13) | 67 (55-79) | 7 | 25 | 3.6 |
| 16a | O-CH2 |
|
H | 1195 | 5.92 (5.84-6.01) | 89 (79-99) | 22 | 68 | 1.3 |
| 16b | O-CH2 |

|
H | 696 | 6.16 (5.99-6.32) | 76 (67-85) | 72 | 99 | 1.8 |
| 16c | O-CH2 |
|
H | 1211 | 5.92 (5.60-6.24) | 42 (28-55) | n.t.d | n.t.d | 2.1 |
| 16d | O-CH2 |
|
H | 2314 | 5.64 (5.43-5.85) | 66 (49-83) | n.t.d | n.t.d | 1.6 |
| 16e | O-CH2 |
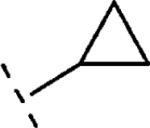
|
H | 1459 | 5.84 (5.61-6.06) | 66 (54-79) | n.t.d | n.t.d | 1.8 |
| 16f | O-CH2 |

|
H | 250 | 6.60 (6.34-6.86) | 73 (55-91) | 46 | 99 | 2.3 |
| 16g | O-CH2 |

|
H | 851 | 6.07 (5.86-6.28) | 71 (60-81) | n.t.d | n.t.d | 1.5 |
| 16h | O-CH2 |

|
H | 96 | 7.02 (6.78-7.25) | 79 (63-95) | 3 | 44 | 3.2 |
| 16i | O-CH2 |

|
H | 66 | 7.18 (6.95-7.41) | 69 (54-83) | 14 | 43 | 3.2 |
| 16j | O-CH2 |

|
2-F | 553 | 6.26 (6.09-6.43) | 72 (64-80) | n.t.d | n.t.d | 3.3 |
| 16k | O-CH2 |

|
3-F | 77 | 7.12 (6.85-7.38) | 61 (40-83) | 18 | 48 | 3.5 |
| 16l | O-CH2 |

|
4-F | 739 | 6.13 (6.02-6.24) | 79 (73-85) | n.t.d | n.t.d | 3.5 |
| 16m | O-CH2 |
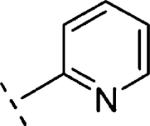
|
H | 1019 | 5.99 (5.82-6.16) | 78 (69-88) | 13 | 99 | 1.6 |
| 16n | O-CH2 |
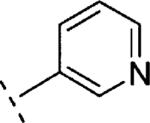
|
H | 1759 | 5.75 (5.59-5.91) | 77 (64-90) | n.t.d | n.t.d | 1.6 |
| 16o | O-CH2 |
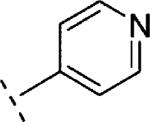
|
H | 2690e | 5.57e | 82e | n.t.d | n.t.d | 1.6 |
| 16p | O-CH2 |

|
H | 621 | 6.21 (6.12-6.29) | 94 (89-99) | 9 | 29 | 1.8 |
| 16q | O-CH2 |
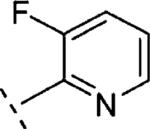
|
H | 791 | 6.10 (5.74-6.46) | 56 (41-70) | 33 | 97 | 1.6 |
Values were calculated from three independent experiments using a four-parameter logistic nonlinear regression model taking into account the heterogeneity between experiments and concentration—response curves for each compound.
HLM and RLM data refer to % of compound metabolized after incubation of tested compound with human and rat microsomes respectively, for 15 min at 1 μM concentration.
Calculated with Biobyte software.
Not tested.
Data obtained from a single experiment not replicated.
