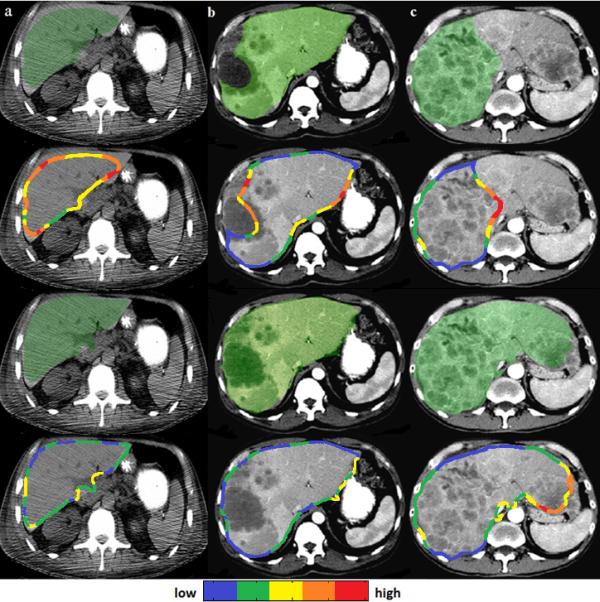
Figure 5.

Examples of liver segmentation (overlaid in green on axial views of 3D CT data) of a case without contrast enhancement and with motion artifacts (a), a moderately inaccurate segmentation (b), and a severe segmentation failure (c). Initial segmentations are shown in the top row and their corresponding shape images in the second row. Shape ambiguities are depicted in a cold (low) to hot (high) colormap. The corrected liver segmentations are shown in the third row and their corresponding shape images in the bottom row.
