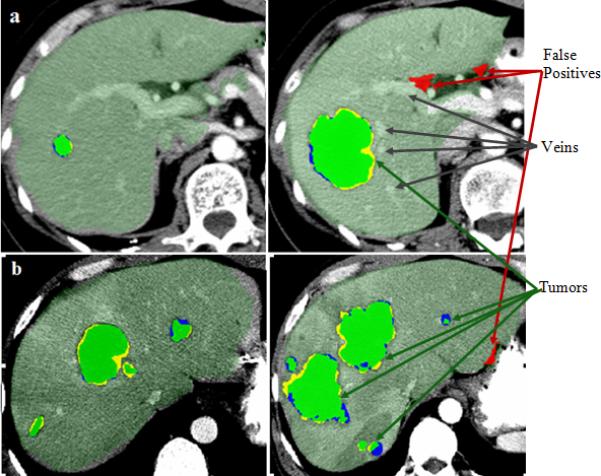
Figure 7.

Examples of hepatic tumor segmentation: manual (blue), automated (yellow) and their overlaps in green overlaid on axial views of 3D CT of two patients (a) and (b), each at two time points (different CT scans of the same patient). False positives from the automated segmentation are displayed in red. The two cases also illustrate the difference in the enhancement protocols with well-enhanced portal and hepatic veins in (a), which are not visible in (b).
