Figure 4.

The molecular surface of the MAYM mutant showing the predicted hydration sites from the restricted simulation. The hydration sites are colored by free energy with respect to bulk water from more positive in blue to more negative in red.

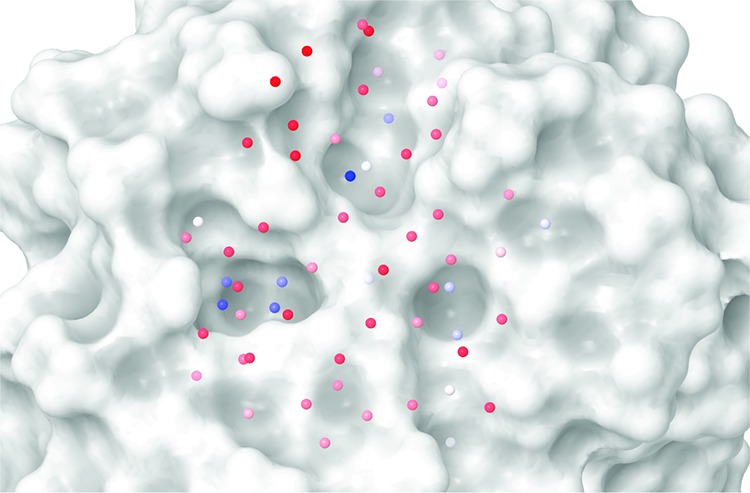
The molecular surface of the MAYM mutant showing the predicted hydration sites from the restricted simulation. The hydration sites are colored by free energy with respect to bulk water from more positive in blue to more negative in red.