
Figure 6.
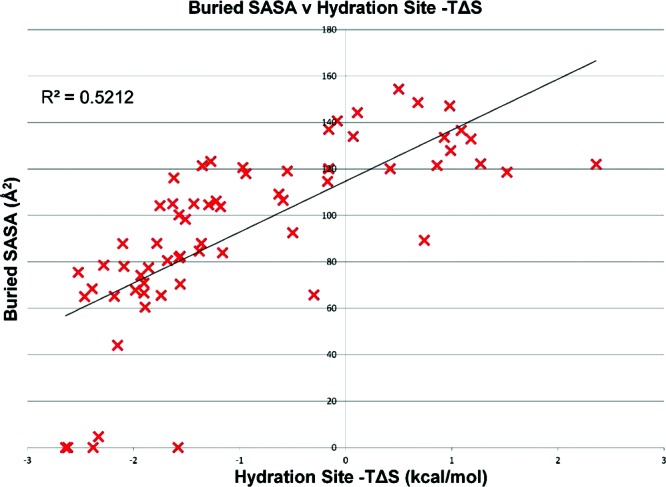
A plot of the change in SASA when a carbon atom is placed at each of the 56 hydration sites predicted by the restrained simulation against the calculated total −TΔS of that site with respect to bulk water.
Official websites use .gov
A
.gov website belongs to an official
government organization in the United States.
Secure .gov websites use HTTPS
A lock (
) or https:// means you've safely
connected to the .gov website. Share sensitive
information only on official, secure websites.
A plot of the change in SASA when a carbon atom is placed at each of the 56 hydration sites predicted by the restrained simulation against the calculated total −TΔS of that site with respect to bulk water.