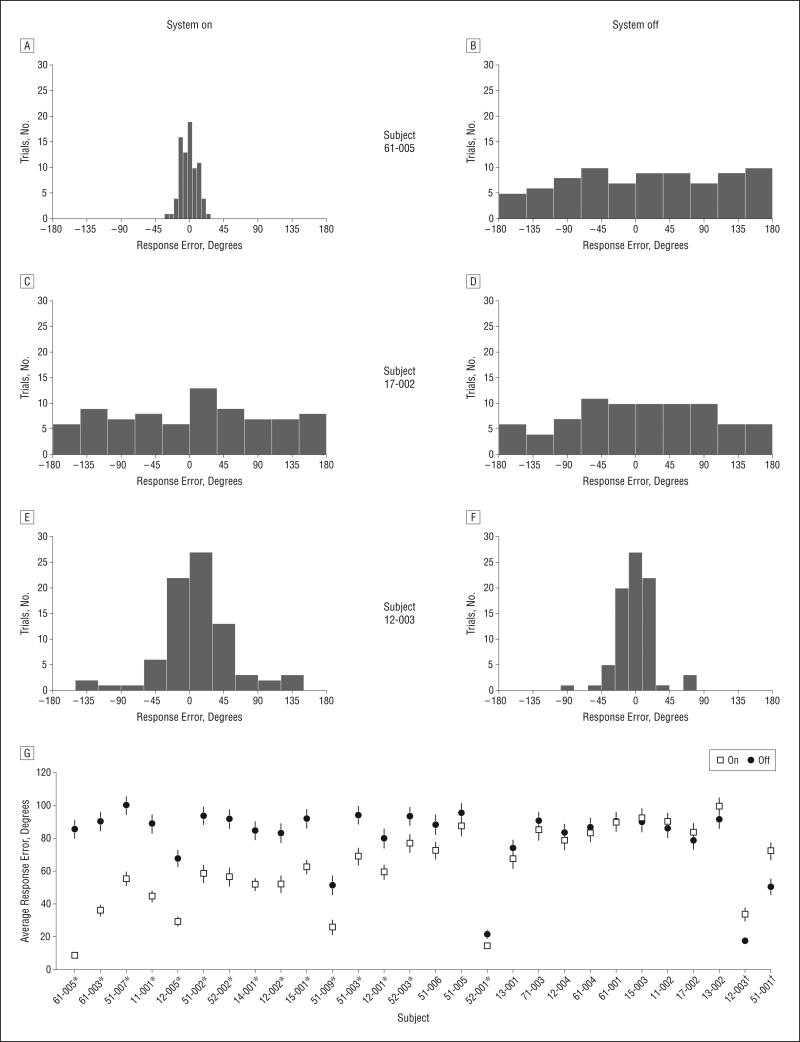
Figure 2.
Graphs of response error distributions. Example distributions of the response error with the system on and off from 3 subjects (A-F). G, Mean response error for all subjects. * Indicates significant differences between mean response errors with the system on and off (t test; P < .05); † indicates subjects who had significantly better performance with the system off vs on. Error bars indicate standard error of the mean.

