
Figure 2.
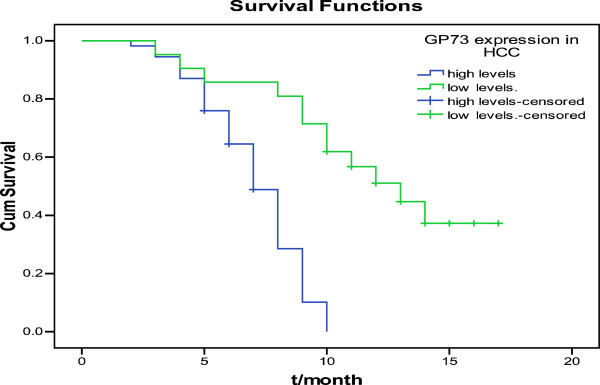
Survival curves of HCC patients with different levels of GP73 expression. The surival curves showed that HCC patients with high levels of GP73 expression were different from patients with low levels.
Official websites use .gov
A
.gov website belongs to an official
government organization in the United States.
Secure .gov websites use HTTPS
A lock (
) or https:// means you've safely
connected to the .gov website. Share sensitive
information only on official, secure websites.
Survival curves of HCC patients with different levels of GP73 expression. The surival curves showed that HCC patients with high levels of GP73 expression were different from patients with low levels.