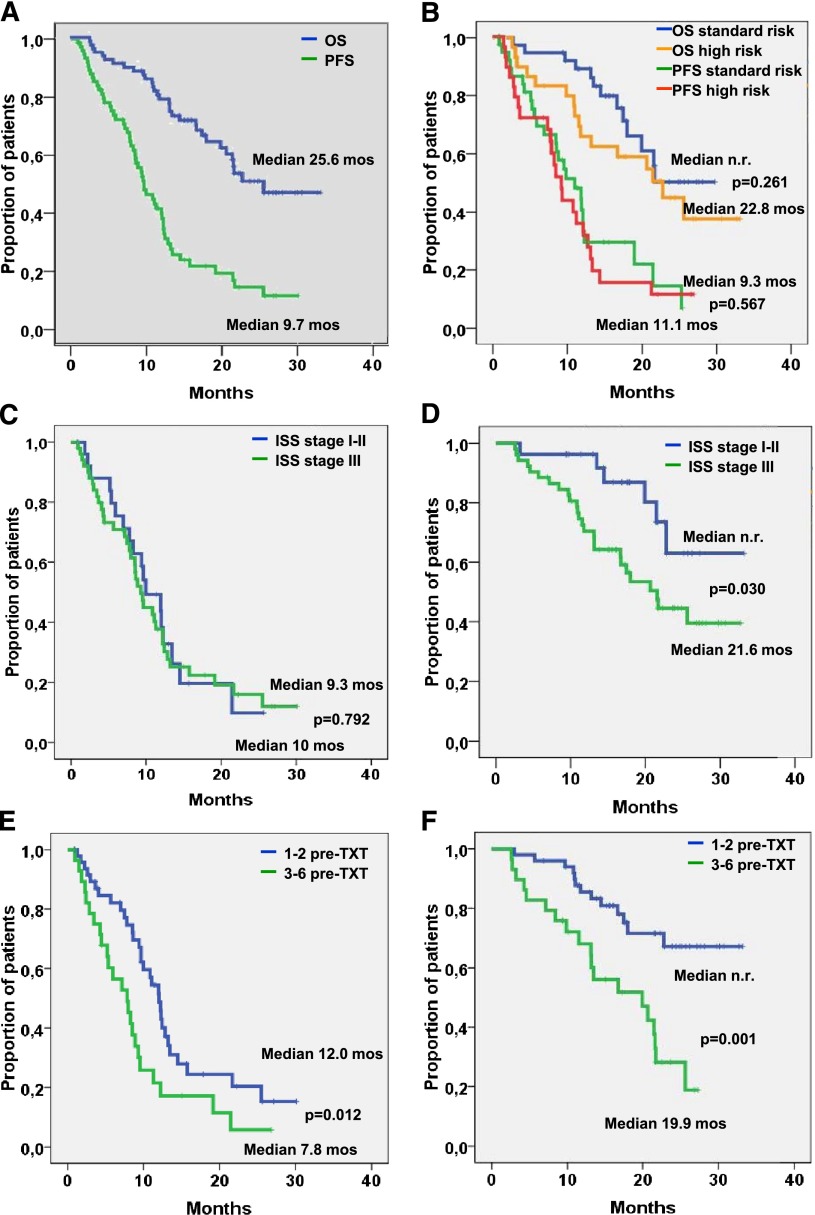
Figure 1.
PFS and OS in different patient cohorts. PFS and OS in (A) all patients and (B) patients with standard-risk and high-risk cytogenetics. (C) PFS and (D) OS in patients with International Staging System (ISS) stage I-II and stage III disease. (E) PFS and (F) OS in patients with fewer than 3 or more than 3 prior treatment lines. n.r., not reached; pre-TXT, pretreatment.

