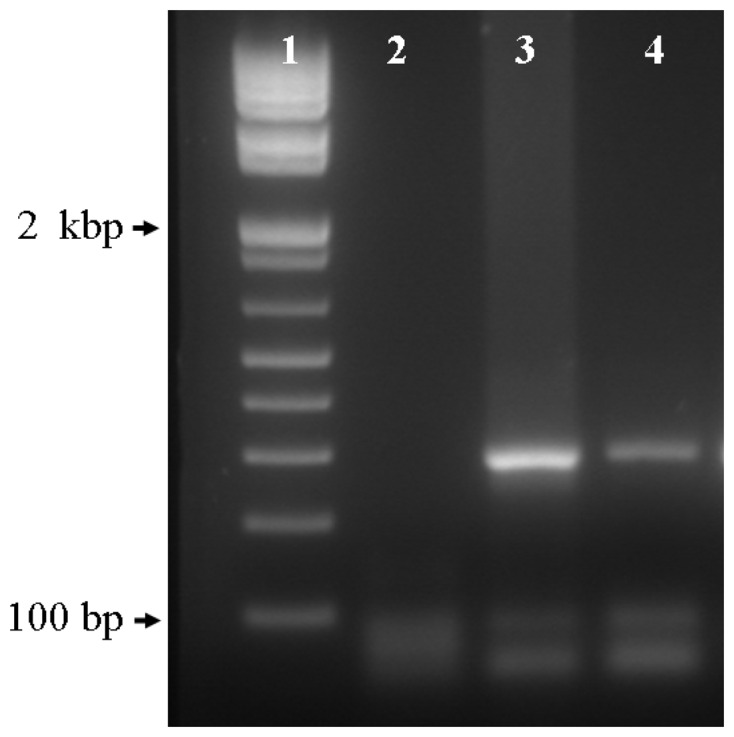
Figure 7.

Representative image of the PCR products from the collected human DNA after translocation through a micro-funnel structure using a -500 mV potential. Lane 1, molecular weight marker, lane 2, PCR negative control; lane 3, PCR product from the remanent DNA collected at the cathode (-); lane 4, PCR product from the DNA that translocated from the cathode and was collected at the anode (+).
