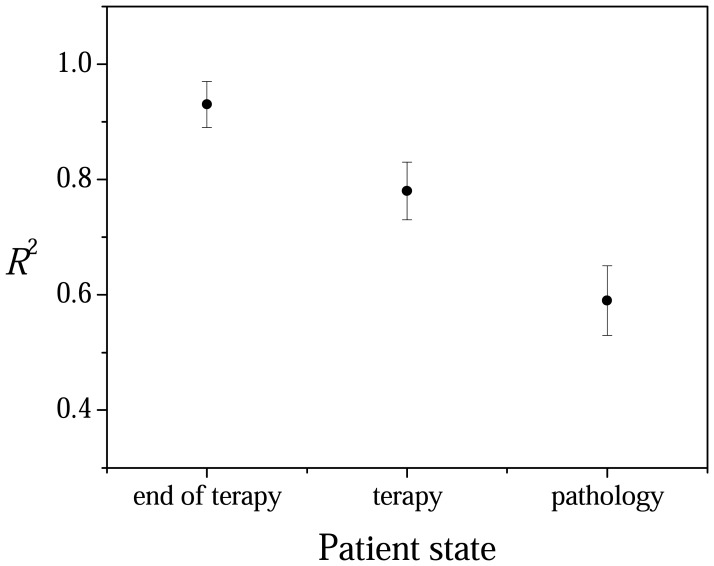
Figure 3.
Behavior of R2 resulting from linear regression of Raman spectra relative to blood serum from patients in the remission stage of illness (recovered), from patients under drug therapy and from PV active patients in the wavenumber 1000-1800 cm-1. Dots and bar indicate the mean of R2 and the error in its determination.

