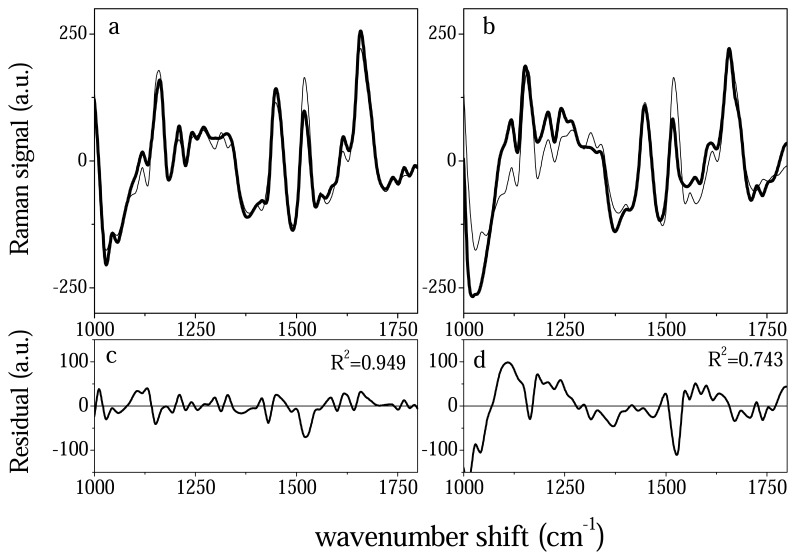
Figure 4.
Typical Raman spectrum from under drug therapy (a) and PV active patients (b). The spectra are compared to the spectrum of recovered patient (thin lines) by means of linear regression analysis. The residual signal between signal in (a), signal in (b) and reference signal (from recovered patient) is reported in (c) and (d) respectively.

