
Supplementary Figure 2. Genes significantly modulated by CD3/CD28 stimulation alone but less modulated in the presence of Akti1/2.
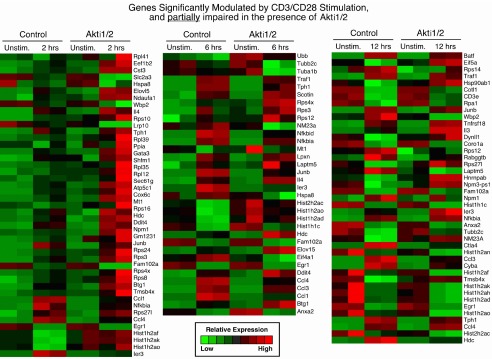
Each row represents a gene and each column shows one of the duplicates from two different groups (from left to right 0 h vs. 2 h, 0 h vs. 6 h, 0 h vs. 12 h). The red and green colors reflect high and low expression levels, respectively.