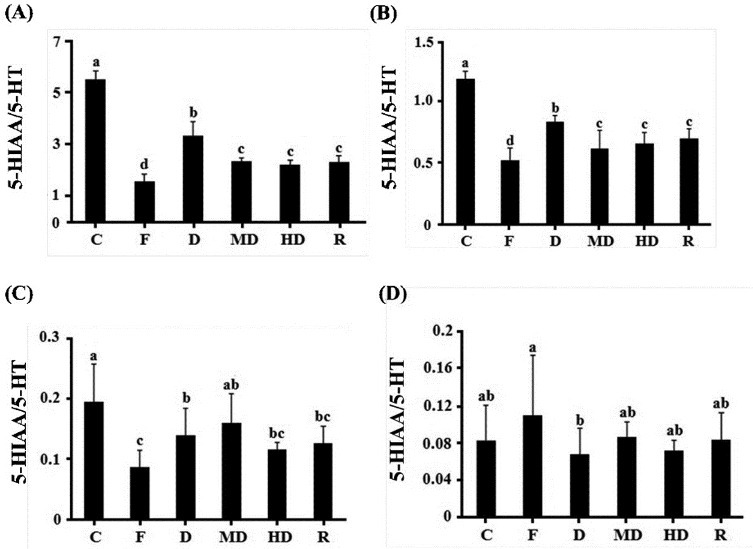
Figure 4.

The metabolic rate of serotonin in chronic experiment in each brain regions. (A) Amygdala (B) hippocampus (C) striatum (D) frontal cortex. C: negative control; F: fluoxetine; D: low dosage of DFEtoH; MD: medium dosage of DFEtoH; HD: high dosage of DFEtoH; R: rutin. abcd data not sharing the same letter are significantly different from one another in each group (P < 0.05) by ANOVA and Duncan's multiple range test
