Figure 5.

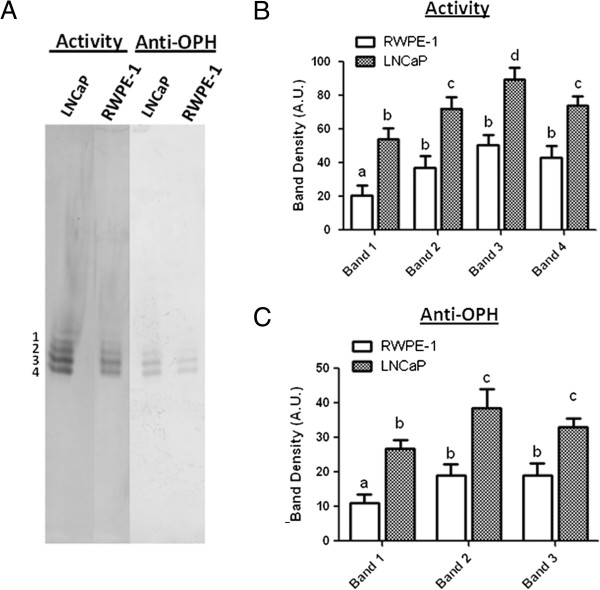
Native electroblot activity staining and anti-OPH reveal OPH bands. LNCaP and RWPE-1 cell lysates each containing 120 μg of protein were subjected to 6% n-PAGE followed by electroblot transfer to a nitrocellulose membrane. A) The blot was stained with 800 μM S-ANAA and Fast Blue RR salt. A parallel unstained blot was probed with anti-OPH as stated in the Materials and methods section. B) The esterase activity and C) anti-OPH bands were measured by densitometry and expressed in arbitrary units (A.U.). Letters that are not the same are significantly different at P < 0.05.
