Figure 9.
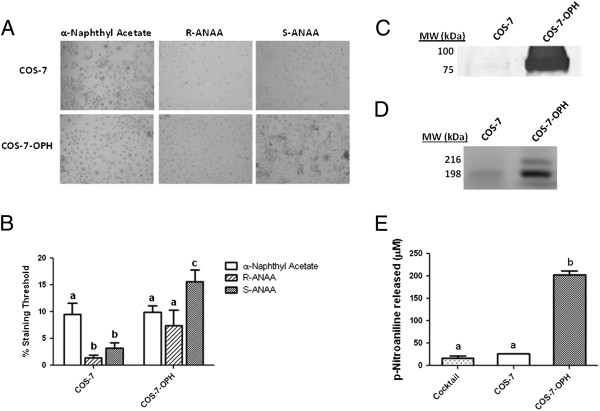
COS-7 cells that over-express OPH show higher levels of ANAA hydrolysis. A) COS-7 and COS-7-OPH cells were treated with 800 μM α-naphthyl acetate, R-ANAA, or S-ANAA substrate and Fast Blue RR salt for 20 minutes. Dark color indicates esterase activity. B) Microscopy images were analyzed with ImageJ to measure the relative staining between cell lines. Percent area threshold was defined as the percent area stained that exceeded background staining. C) Anti-OPH Western blot of COS-7 and COS-7-OPH lystates containing 90 μg of total protein. D) Cell lysates containing 120 μg of protein were separated by 6% n-PAGE followed by staining with 800 μM S-ANAA. E) Lysates were incubated with 4 mM N-acetyl-L-alanyl-p-nitroanilide and the amounts of p-nitroanaline released after 10 minutes were measured. Letters that are not the same are significantly different at P < 0.05.

