
Figure 3.
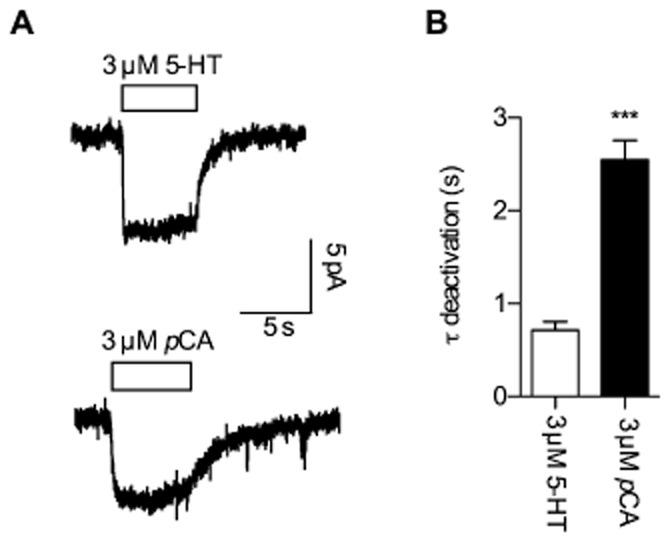
Comparison of current responses to 5-HT and pCA in HEK293 cells expressing SERT. Cells were continuously perfused with buffer and voltage clamped to −70 mV utilizing the whole cell patch clamp technique. (A) Inwardly directed currents provoked by 3 μM 5-HT (upper trace) or 3 μM pCA (lower trace); 5-HT/pCA were applied for 5 s and then removed from the solution utilizing a fast perfusion system (see experimental procedures). (B) Current deactivation upon removal of 5-HT and pCA was fitted to a mono-exponential function and the time constants derived were plotted in a bar graph. Comparison of the decay time constants following 5-HT removal (0.712 s ± 0.094 s, n = 9) and pCA removal (2.549 s ± 0.208 s, n = 9) reveals a significantly slower time constant for pCA (*** = P < 0.001, Mann–Whitney U-test).