
Figure 6.
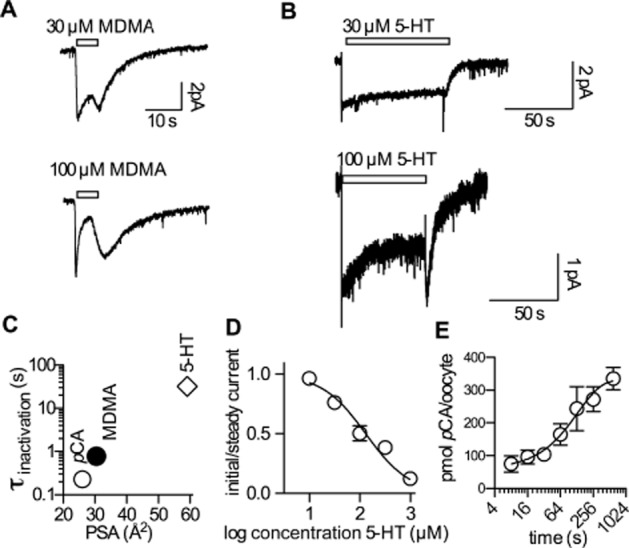
Current inhibition is a consequence of internal substrate accumulation. (A) Representative currents recorded in HEK293 cells at −70 mV induced by 30 and 100 μM MDMA respectively. MDMA was applied for 5 s and then removed from the external solution. Similar to the pCA-induced current (compare Figure 4), the current inactivated rapidly within the application time. The extracted time constants were 930 ms ± 180 ms (n = 5) and 780 ms ± 150 ms (n = 5) for 30 and 100 μM MDMA respectively. (B) Currents induced by 30 and 100 μM 5-HT; 5-HT was applied for an extended time period (see scale bar). In the case of 100 μM 5-HT, the current reached a steady level at about 50% of the initial amplitude. The respective time constant for current inactivation was 32 s ± 11 s (n = 6). (C) The logarithm of the time constant for current inactivation (σinactivation) at 100 μM pCA, MDMA and 5-HT was plotted as a function of the polar surface area (PSA); these values were taken from chemicalize.org. (D) The ratios of the initial current amplitude and the steady current amplitude are plotted as a function of increasing 5-HT concentrations. Each data point is the average of six experiments. The average values were fitted to the following equation: Y = 1/(1 + 10∧((X-logIC50))). The extracted IC50 was 131 μM [95% confidence interval: 83.36–207.8 μM]. (E) pCA uptake into uninjected Xenopus laevis oocytes. The level of accumulated pCA in pmol per oocyte is plotted as a function of the exposure time to pCA (100 μM). Each data point is the average of six experiments. The line indicates a fit to a mono-exponential function. The extracted time constant was 134 s [95% confidence interval: 83–345 s].