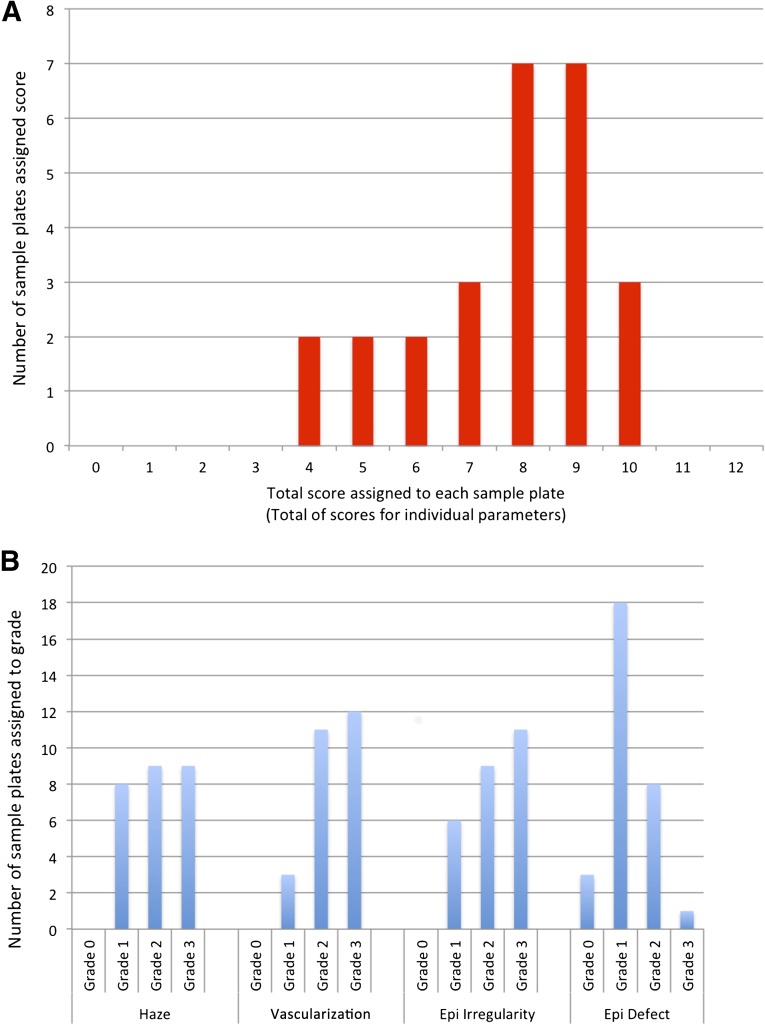
Figure 2.
Graphs used to assess distribution of grading scores. (A): Distribution of global scores (the sum of the scores assigned to each of the four key signs of limbal stem cell deficiency [LSCD]) for 26 patients with limbal stem cell deficiency. Scores were distributed over a wide range on the scale, reflecting the range of LSCD severities in the population sample. (B): Distribution of scores within individual clinical parameters. Scores again show an even distribution with the exception of grade 1 epithelial defects. Abbreviation: Epi, epithelial.

