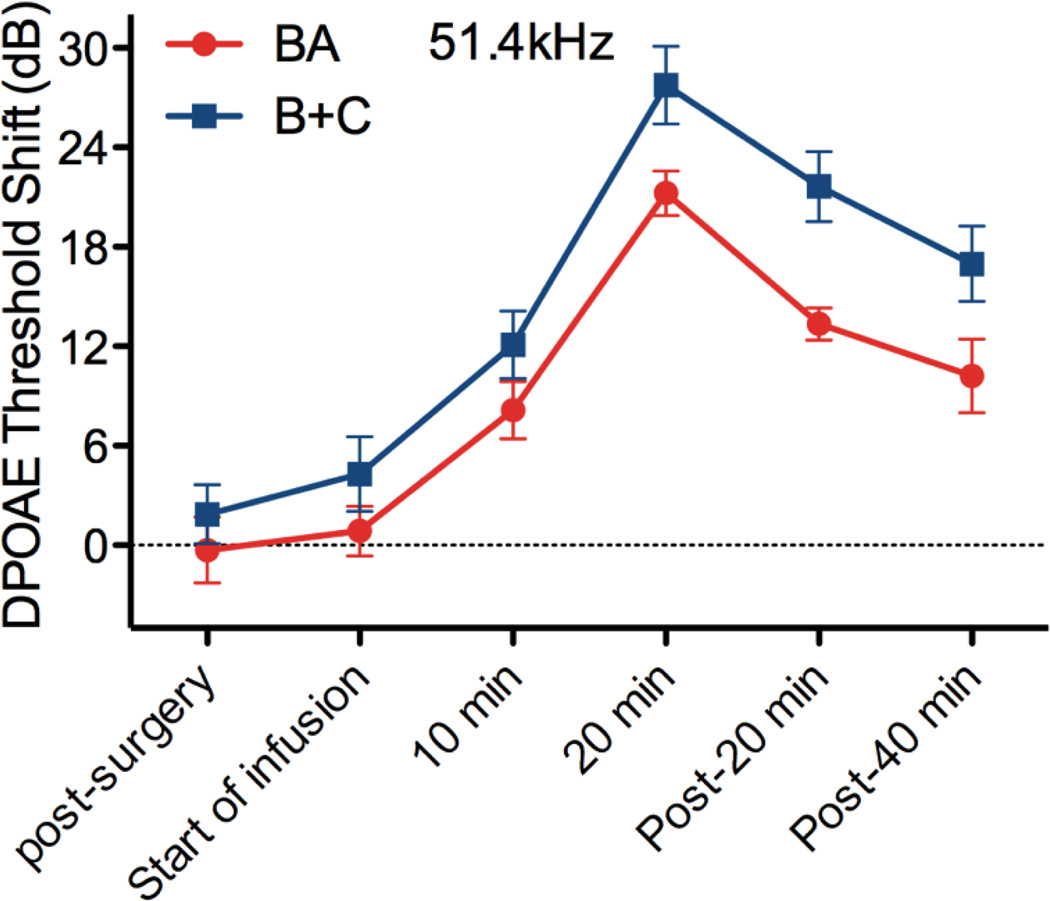
Figure 5.
DPOAE threshold shifts for the most basal F2 frequency over time. After infusion is stopped, there is a reduction of approximately 0.3dB per minute for the B+C approach suggesting a decline in basal salicylate concentration. This rapid decline may enable concentration control via flow control at the RWM niche. Data are plotted as mean ± SEM (n=6 animals for each approach).

