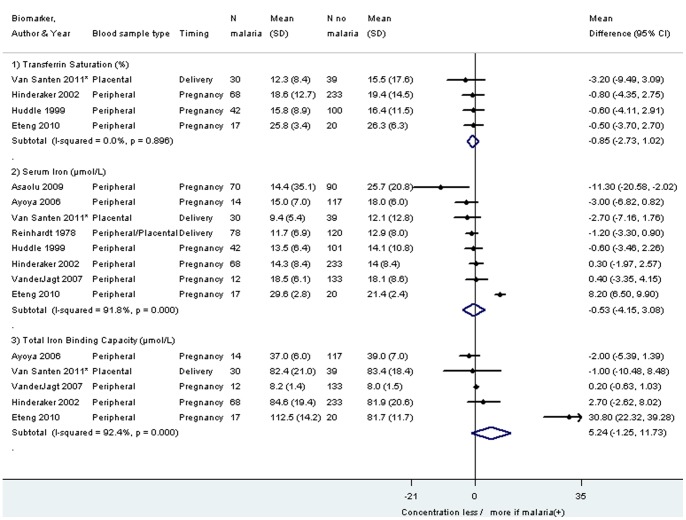
Figure 7. Mean difference in transferrin saturation, serum iron and total iron binding capacity among pregnant women infected with malaria compared to pregnant women without malaria.
Footnote: CI: confidence interval. SD: standard deviation. *Van Santen 2011: study population primigravidae. The weight for each study is indicated as a grey block around the risk estimate. Removal of the study of Eteng 2010, an outlier for Serum Iron and Total Iron Binding Capacity, gives the following results: Pooled mean difference serum iron (μmol/L): −1.13, −2.57 to 0.31, I2 27.3%; Pooled mean difference Total Iron Binding Capacity (μmol/L): 0.13, −0.67 to 0.92, I-squared 0%.

