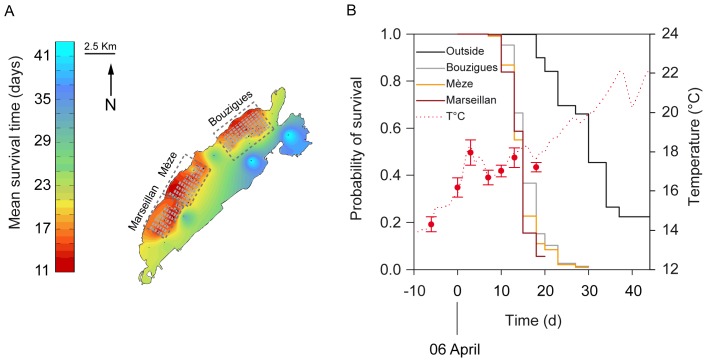
Figure 2. Survival of oysters in the Thau lagoon.
(A) Kriged map of the mean survival time of oysters in the Thau Mediterranean lagoon. Mean survival time was measured as days from 6 April, when seawater temperature reached 16°C. Black points represent sampling sites, areas with grey boxes represent bivalve farms and dashed rectangles correspond to the three farming areas. (B) Left axis: survival functions of oysters for each area of the lagoon. Right axis: evolution of seawater temperature during the period of study. Temperature was recorded continuously at one location within the bivalve farming area of Marseillan (dotted line), and punctually at all locations (red circles, data are means ± SD).

