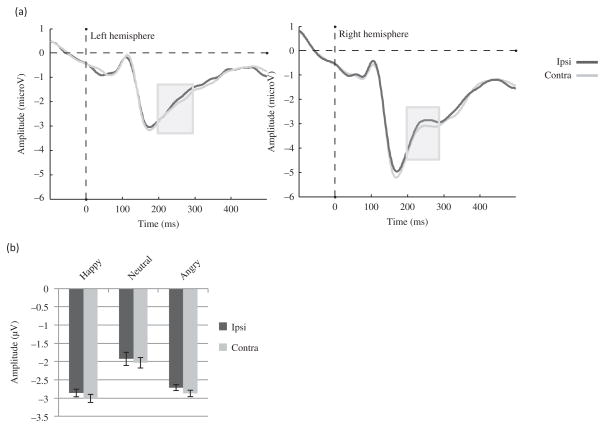
Figure 8.
EDAN component to the face cue in Experiment 2. (a) Effect of Gaze laterality on the group ERP waveforms (averaged across emotions and across electrodes). The gray zone marks the time limits of the analysis (200–300 ms) and (b) group amplitudes for contralateral and ipsilateral gaze directions averaged across emotions and electrodes between 200 and 300 ms.

