
Figure 4. Expression of PhHD-Zip in petunia flower under abiotic stress.
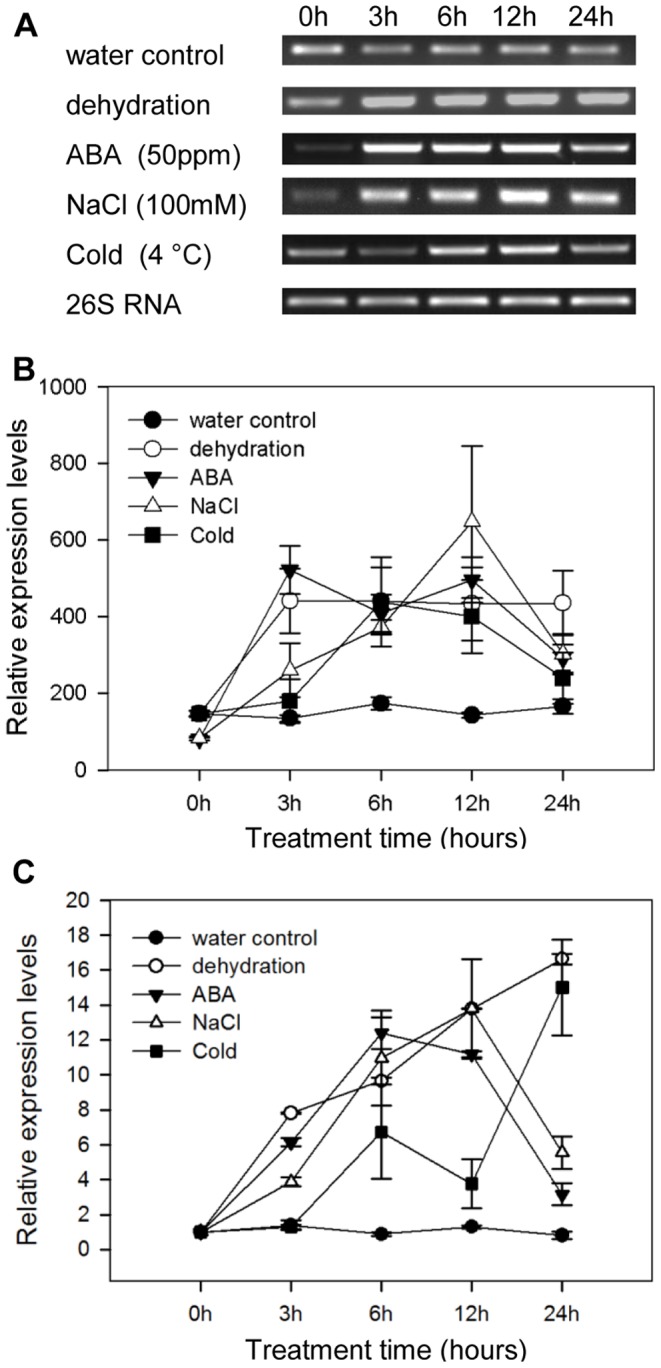
Petunia flowers harvested at anthesis were placed in tubes with water, without water, with 50°C. A. A representative gel image from semi-quantitative PCR of RNA isolated from corollas harvested at intervals. 26S RNA: the internal control. Samples were analyzed after 30 cycles for PhHD-Zip, and after 24 cycles for 26S RNA. B. Relative expression levels of PhHD-Zip (quantification of the gel pictures; error bars show SE of the means of three biological replicates). C. Relative expression levels of PhHD-Zip determined using the same RNA samples, but using real-time quantitative PCR (error bars correspond to SE of the means of three biological replicates).