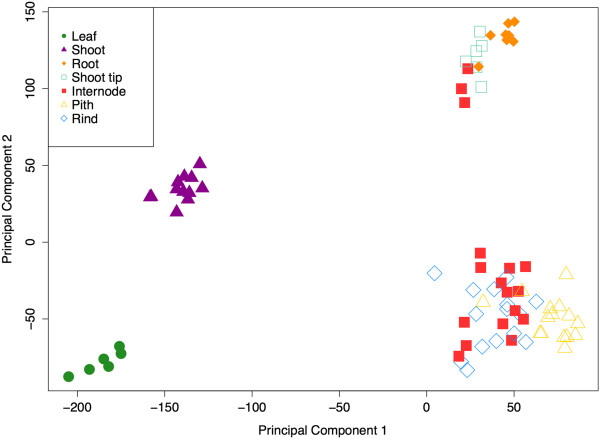
Figure 4.
Classes sharing similar expression patterns. Principal component analysis was applied to 78 tissue samples, based on expression of 29,065 probe sets (27,577 genes, 654 controls and 834 small RNA probe sets). Each symbol represents a single sample. Tissue types are indicated by color and shape of symbol.

