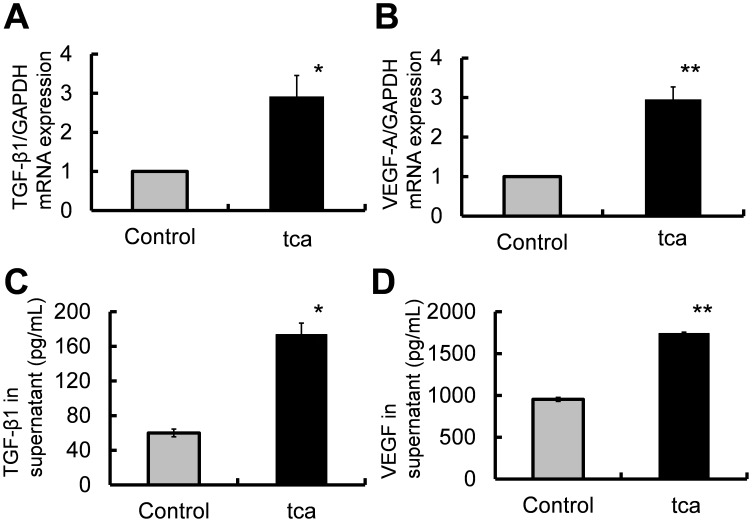
Figure 2. Quantification of TGF-β1 and VEGF-A mRNA and protein levels.
(A, B) Control cells were cultured in the medium without TCA and tca cells were cultured in the medium with 2 mM TCA. Total RNA was extracted from these cells and expression levels of TGF-β1 and VEGF-A mRNA were evaluated by qRT-PCR. (C, D). Culture supernatants were collected from control cells incubated in the medium without TCA and tca cells incubated in the medium with 2 mM TCA for 24 h. (A) TGF-β1 mRNA levels in tca and control cells (*P<0.05). (B) VEGF-A mRNA levels in tca and control cells (**P<0.01). (C) Comparison of the mean level of secreted TGF-β1 in the media from tca vs. control cultures (**P<0.01). (D) Comparison of the mean level of secreted VEGF protein for tca vs. control cells (**P<0.01).

