
Figure 1. Percentages of substrate mass remaining in each of the different N treatments.
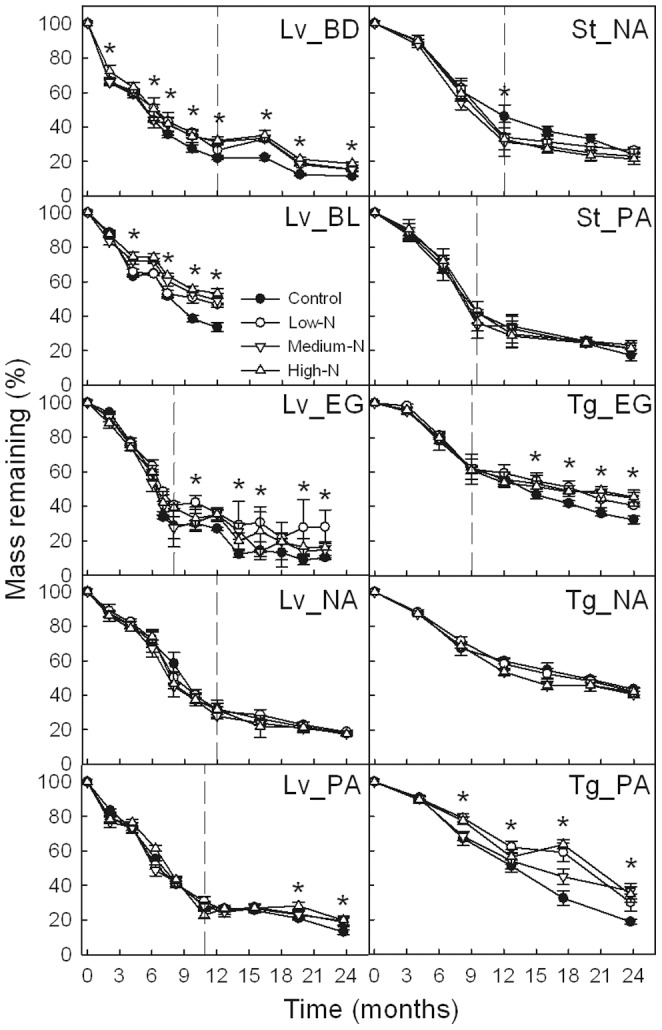
Error bars represent the standard deviations of the means (n = 3). Lv_BD, Lv_BL, Lv_EG, Lv_NA and Lv_PA indicate leaf litter at the BD, BL, EG, NA and PA sites, respectively; St_NA and St_PA indicate sheath litter at the NA and PA sites, respectively; Tg_EG, Tg_NA and Tg_PA indicate twig litter at the EG, NA and PA sites, respectively. Asterisks (*) indicate significant difference between the control and at least one N treatment (α = 0.05). Two distinct stages were observed for most of the litter substrates (initial rapid decomposition rate followed by a slower rate) separated by dashed lines.