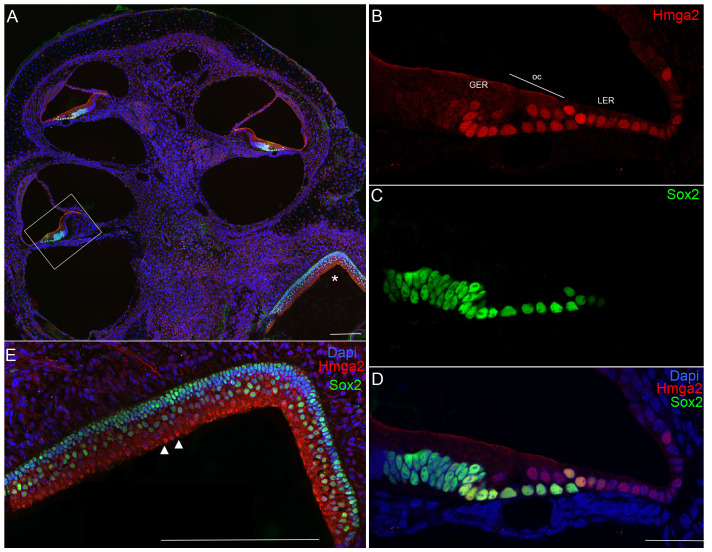
Figure 5. Hmga2 expression in postnatal day-3 (P3) inner ear (A–D).
Low-magnification micrograph of inner ear longitudinal section (A) immunostained with Hmga2 (shown in red) and Sox2 (shown in green). Higher-magnification view at the level of the basal cochlear turn (B–D) in the region indicated by the box in (A). Hmga2 expression is observed in the nuclei of hair cells and different supporting cell subtypes. Hmga2 is colocalized with Sox2 in the supporting cells within the organ of Corti's area (shown in yellow). Intense Sox2 signal (shown in green) is also observed in cells of the GER. Higher-magnification of the utricular macula (E) in the region indicated by asterix in (A) showing moderate Hmga2 (shown in red) expression at the lumenal hair cell layer while Sox2 (shown in green) expression is restricted to supporting cells at basal layer of the macula. In all panels, cell nuclei are counterstained with DAPI (blue). Scale bars = 100 µm in (A,E) and 50 µm in (B–D).

